
The biggest unknown variable in the oscillating engine simulator is the amount of friction loss that an engine is likely to experience. To calibrate the simulation I have measured the speed of my engine at various supply pressures and then simulated the same conditions, adjusting the simulated loss until the speed matches.
You may recall that my engine was not working very well because the port faces were not sitting flat. My Dad suggested an easy fix would be to enlarge the pivot hole so that the spring is able to pull the faces together. That's easier than anything else I had in mind, so I have done it. I only drilled it out by 0.2mm. You can still hear air leaks when the engine stalls, which suggests there is still not a perfect seal, but that is probably unavoidable.
1. Gathering data
Methodology
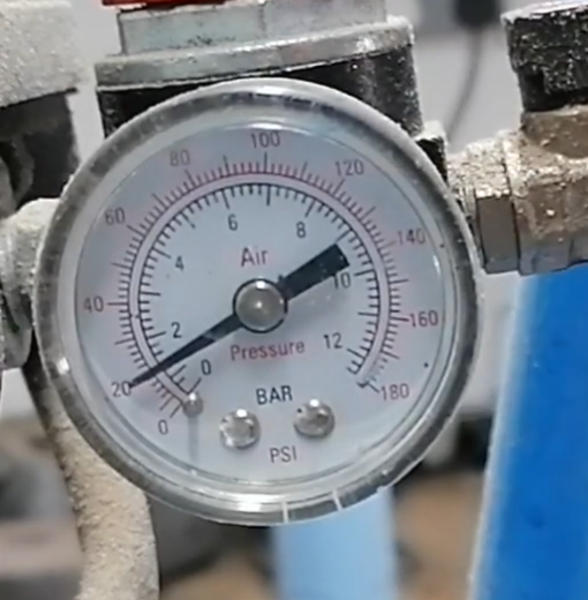
I set up a video camera pointing at the pressure gauge on the compressor, and within earshot of the engine. Using the view of the pressure gauge I can tell what pressure is being supplied to the engine, and by counting pulses on the audio track I can tell what speed the engine is running at. I adjusted the regulator to change the supplied pressure, and allowed the engine to run for a few seconds to stabilise before adjusting the regulator again.
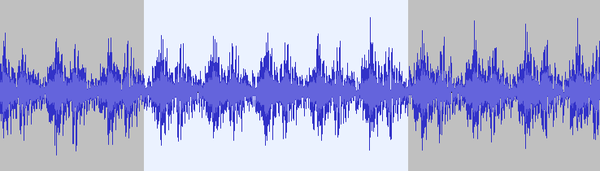
I then watched the video and noted down timestamps at which the engine speed was stable, along with the corresponding pressure at that time. I then scrolled through the audio track in Audacity and counted the pulses.
The highlighted portion corresponds to 5 revolutions. Audacity says the selection spans 512ms. 5 revolutions in 0.512 seconds = 9.77/sec = 586 rpm
My data is all in a LibreOffice spreadsheet in case you want to look at it. And the source video is on YouTube.
My Wig-Wag is not built exactly to the drawings. The bore is 15.2 mm (+0.2mm vs spec), the length from the crank pin to the top of the piston is 61mm (-2mm vs spec), and the gap above piston at top dead centre is 8mm (+3.25mm vs spec, I am as confused as you about where the extra 1.25mm has come from).
Confounders
That some air leaks out when the engine is stalled implies that the port face is not a perfect seal. This also implies that some air leaks out while the engine is not stalled (but you can't hear it over the noise). But the simulation assumes the air path is perfectly sealed. Maybe the simulation should gain a parameter to configure the diameter of a "leak hole" in the top of the cylinder, to simulate the leak from the port faces.
It is likely that when the inlet port is open, the actual available pressure drops, but this is not reflected in the gauge because of the length of hose in between the gauge and the engine. To find out, we should put a pressure gauge closer to the engine.
The lowest marked point above 0 on the pressure gauge dial is 10 psi (~69 kPa), and the scale is very obviously linear everywhere except at the lower end, where there is not much of a gap between 0 and 10 psi. This makes me suspect that the scale is not very accurate at the lower end, so the data I have recorded is likely to be less accurate at lower pressures than at higher pressures.
Results
Evaluation
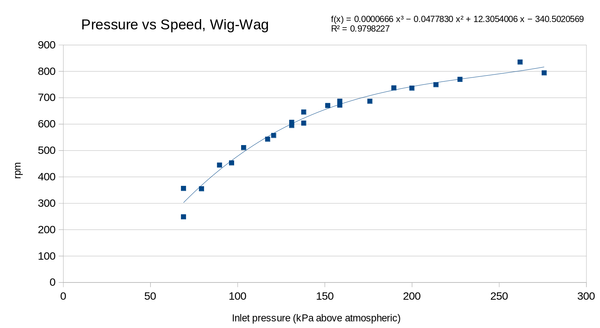
For a sanity check, we can compare the qualitative shape of the curve to pressure-speed curves generated from the simulator, and find that it matches pretty well: as you increase the pressure more and more, the engine speeds up less and less (diminishing returns). Also, the curve intersects the x axis and not the y axis, which means there is a minimum pressure required for the engine to run, and it will not run at 0 pressure.
2. Calibrating losses
Methodology
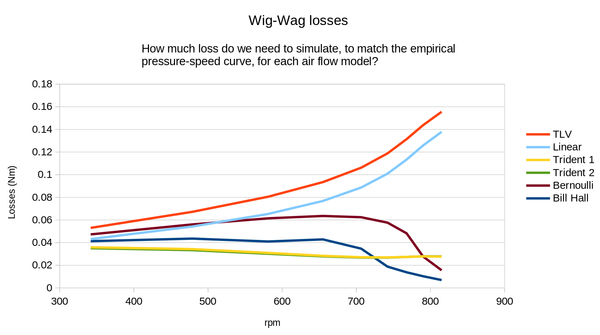
For each of the air flow models in the simulator (TLV, Bill Hall, Trident 1, Trident 2, Bernoulli, Linear), and for supply pressures at 25 kPa intervals from 75 up to 275, I adjusted the simulated friction losses of the engine until the simulated engine was running at the same speed as the real engine.
Under the assumption everything else is accurate, we have thus determined the amount of friction losses that the real engine was suffering from at this speed.
Results
Evaluation
Aside from TLV and Linear, all of the other air flow models have regions where increasing the engine speed actually decreases the amount of friction. This is intuitively tough to swallow, although you might be able to argue that some parts of the engine are transitioning from stick-slip to sliding friction (maybe the port faces?).
I think this is not the reason. I think the problem is simply that those air flow models are too pessimistic about how quickly the air can flow in/out of the engine, so the only way to make the speed match as pressure increases is to let them have less friction. The loss curves for "TLV" (from TLV) and "Linear" (my uninformed guess at how air flow works) look much more believable to me. Since the TLV model is from "A Steam Specialist Company", and the Linear model is pulled out of my bum, I'm going to say the TLV model is probably the better one.
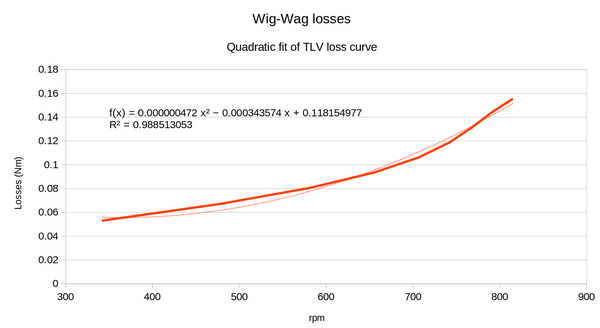
Currently the simulator only accepts a linear loss model (i.e. a static amount of loss, plus a loss that rises proportional to engine speed). I tried fitting a quadratic curve to the loss data from the TLV model. It doesn't look exactly the right shape, but it is better than a straight line:
3. Conclusion
The next things to try are:
- run the same measurement again but with a second pressure gauge, closer to the engine, to see how much the supply pressure actually drops when the port opens
- add a "leak hole" to the simulator and see if adjusting the size of the leak hole can make the simulated engine better match the real one
- make the simulator accept a quadratic loss model, and configure it according to the discovered curve above
- absent any indication to the contrary: eventually remove all of the air flow models except for TLV