
I've been working on a compiler for the SCAMP CPU. It compiles a language I'm calling "SLANG" (which just stands for "SCAMP Language" pending a better backronym) into SCAMP assembly language.
You can view SLANG as a "slightly less-safe C", without arrays, structs, or unions, and a bit easier to parse.
If you want, you can look through the current Perl implementation of the SLANG compiler, or the SLANG-in-SLANG implementation. They are both structured the same: read the source into memory, and parse it with a hand-written recursive-descent parser, printing assembly code to stdout during parsing. The Perl implementation only exists for bootstrapping purposes.
I've also added a "profiling" feature to the SCAMP emulator. This collects data on how much time is spent at each address, how much time is spent on each instruction opcode, and how many reads/writes are done to each address, and generates HTML reports like this:
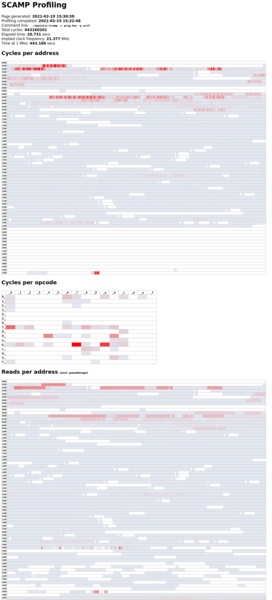
(I would link to an example, but it's about 35M of HTML so only really useful for local viewing - it contains multiple large tables each containing tens of thousands of cells! But there is some easy low-hanging fruit, like encoding the cell background colours using 100 or so classes with short names, rather than style="background-color:rgba(...)" for every single one. Maybe I'll fix that at some point, but it's not a problem for me at the moment.)
The time spent adding the profiling feature was of extraordinarily high value, because it immediately revealed 1 stupid performance bug in the SLANG compiler, and 2 "unintended code execution" bugs (1 a silly compiler bug, 1 a fun microcode bug) that might have been quite difficult to debug had they ever caused a problem.
This is another long post. If you only want to read 1 section, I'd suggest ctrl-f for "subtle microcode bug".
SLANG
Ben tells me that Goldman Sachs use Slang internally and Some Goldman programmers say they love Slang. So at least I've got that going for me.
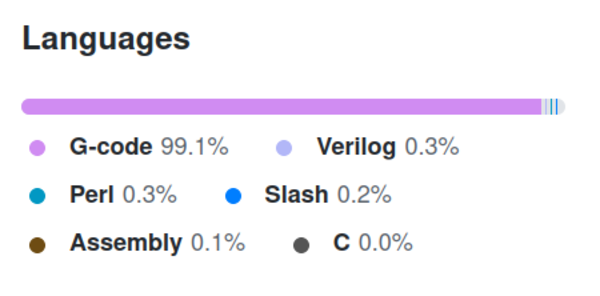
Github thinks SLANG code is actually "Slash", presumably based on the file extension (I'm using .sl):
Types
SLANG only has one type. It's called "var" and it stores a 16-bit word. This can be a signed or unsigned integer value, or a pointer to anything you want, including a function. Functions don't directly exist as a type of thing, only function pointers exist. Declaring a function in SLANG results in an expression that yields a pointer to the function, so functions are declared like this:
var f = func(x) {
    return x+5;
};
This also trivially allows anonymous functions, you can imagine something like:
sort(array, array_length, func(a,b) { return a<b });Only having function pointers, and only 1 type of "var", means there are no function signatures. When you call f(x) there is nothing that is actually checking (either at compile time or runtime) that you've passed the right number of arguments. And if you pass the wrong number of arguments, then the stack pointer will be in the wrong place when the function returns, and everything will go off the rails in confusing and hard-to-debug ways. All just part of SLANG's charm :).
The fact that the only way to call a function is via a function pointer also means that there is an extra level of memory indirection on every single function call, compared to what a C compiler would do. I don't mind though. It only costs 1 extra clock cycle.
Array indexing
There is also no array indexing syntax, but there is pointer arithmetic. Array accesses look like *(array+index) (incidentally, in C, array[index] is defined to be equivalent to *(array+index) - I may eventually add similar syntactic sugar). By way of an example, here's a possible implementation of puts():
var puts = func(s) {
    var i = 0;
    while (*(s+i)) {
        putchar(*(s+i));
        i++;
    };
};
Although the one I'm currently using is a little bit shorter:
var puts = func(s) {
    while (*s)
        putchar(*(s++));
};
By convention, a string is a nul-terminated array of characters, just like in C, so puts() just passes each character to putchar() until it reaches a character that is 0.
Semi-colons
The grammar around semi-colon placement is slightly different to C. A trailing semi-colon on the last statement of a block is optional. While loops and if statements are considered single statements, and require a trailing semi-colon (unless they're the last statement in a block) even if braces are used:
if (x == 5) {
    puts("This line needs a semi-colon\n");
    puts("This line doesn't\n")
}; # This one does
puts("foo\n") # This one doesn't, assuming it's the last line in its block
Parsing
Through serendipitous timing, Nicolas Laurent released the recorded video lectures for his 2021 compilers course just as I was getting around to starting on the compiler. I watched the first few of his videos and found 5. Writing Parsers by Hand particularly useful. I copied the structure of his recursive-descent parser when writing the SLANG compiler: the input is slurped into memory, with a global value storing a "cursor" location, and each parsing function either matches, which means it consumes the input characters that it matched, updates the cursor, and returns 1, or it doesn't match, which means it leaves the input cursor alone and returns 0. This interface makes it very easy to reason about the parser. I gather that the later lectures are more about using a parser generator, which is not ideal for my use case, because then I'd need to write the parser generator as well as the compiler. I still plan to watch the rest of the series as I'm sure there will be plenty of useful stuff to learn.
Code generation
I also found David Given's video Hjalfi writes a compiler, in which he writes a Cowgol compiler, quite useful. It's an 8-hour-long narrated screen recording. I didn't watch the whole thing, and didn't watch all I did watch in one sitting, but I watched enough to learn a lot. He uses lex/yacc to do the parsing, but the key insight I got was the idea of emitting code immediately as the input is parsed, rather than generating an abstract syntax tree in memory and then turning that into code later.
Parsing each term of an expression generates code to push its value onto the stack, and parsing an operator generates code to pop 2 arguments off the stack, apply the operator, and push the result onto the stack. Helper functions are used to generate code to push the values of named variables (which can either be globals, at fixed addresses, or locals, which are stored on the stack, and accessed relative to a stack frame base pointer), and to store the top value of the stack to a named variable.
You can kind of view the parser's call graph as an implicit AST.
Optimisation
One of the weird things about this kind of compiler is that it turns something like var foo = 5; into:
push 5
pop x
ld (_foo), x
instead of simply ld (_foo), 5. The reason is that the code that is responsible for parsing "5" has absolutely no idea what context it is to be used in. It just parses a numeric literal and generates code to push it onto the stack. This results in a simple compiler, but particularly awful code. Fortunately, it is quite easy to clean up after-the-fact with a peephole optimiser, which is another idea I first learnt from David Given. The idea is to go over the generated assembly code applying simple optimisation rules to very short localised sections. A particularly effective example is that push x followed immediately by pop x is a no-op, so you can safely delete both instructions. The generated code doesn't do precisely the same thing (because the value in the X register should have got put on the stack just below the stack pointer) but for the code generated by the compiler it is equivalent.
I have written a simple peephole optimiser, and it reduces runtime of the integration test by nearly 40%, while also reducing the generated code size by about 20%.
Another weird thing that comes from generating code immediately as the source is parsed is that function declarations appear exactly where they appeared in the source. Imagine some code like:
var f1 = func(x) { return x+1; };
puts("Hello, world!\n");
var f2 = func(x) { return x+2; };
The expected result is that f1 is initialised, and then "Hello, world!" is output, and then f2 is initialised. But we don't really have a lot of freedom about where the functions are located in the generated code. My solution is to write each function out exactly where it appears, and a jmp instruction beforehand to skip over it.
The SLANG-in-SLANG compiler is generating code that is almost bytewise identical to that produced by the Perl version (in fact, diffing its generated code is how I verify that it's working correctly!). The only difference is the ordering of the space allocated for globals at the end of the code: the Perl version sorts the globals and the SLANG version generates them in the order that they appeared in the source.
Writing a compiler as a mind-expanding learning experience
I have really enjoyed working on the compiler. It is the most complicated bit of programming I've done in a while. I've previously been put off trying to write compilers because I'm obviously not going to do anything better than what's already been done, but the beauty of compiling a weirdo made-up language for a weirdo made-up CPU is that I'm automatically best-in-class. I'd encourage anyone interested in programming to dabble in writing a compiler. Part of what made it a good learning experience is that it forced me to concretely understand a lot of little details, like calling conventions, that I kind-of sort-of thought that I could understand if needed, but rarely had any need to dig into.
Profiling
At every clock cycle, the emulator increments counters:
- number of cycles spent executing code at the current program counter address
- number of cycles spent executing the current opcode
And at every memory access, the emulator increments a read or write counter for the accessed address. When running with -p, the emulator writes this data out to a file after the program has halted, and profhtml turns this into a slightly-interactive HTML report.
Looking at a HTML page showing 3 different views of the SCAMP machine's entire address space really highlights just how powerful modern computers are compared to what SCAMP will be capable of.
I initially wanted to use this data to tell me which functions from the SLANG standard library would be worth hand-optimising in assembly language, but I found that the visibility it gave me into the machine state actually yielded even more useful results than that, and even more quickly.
1. Quadratic strlen bug
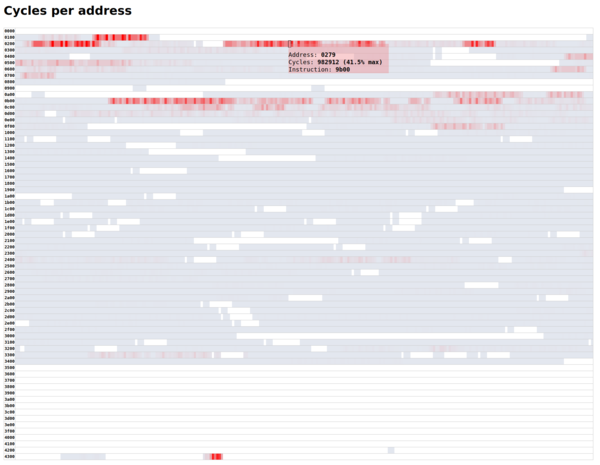
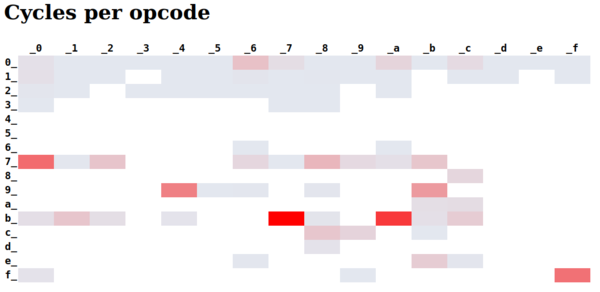
My first results with the SLANG-in-SLANG compiler were showing that at 1 MHz it would take 7 minutes just to parse the code for the compiler integration test. That's before it was even generating code. The profiler showed this:
That's one hell of a hotspot!
I initially thought the profiler was broken. How can it only be executing code at like a dozen addresses? I looked up those addresses in the generated code and it turned out to be strlen(). The compiler was reading the input like this:
while (gets(buf+strlen(buf), 16384));i.e. read a line at a time, and append it to the end of buf. The problem is that buf gets longer each time, and strlen(buf) is O(n) in the length of buf. Classic mistake. I actually knew this was bad, but didn't realise just how bad it would be on such a slow machine. More than 5 of the 7 minutes of execution time would be spent counting the length of the input that it has read so far, just so that it knows where to put the next line of input...
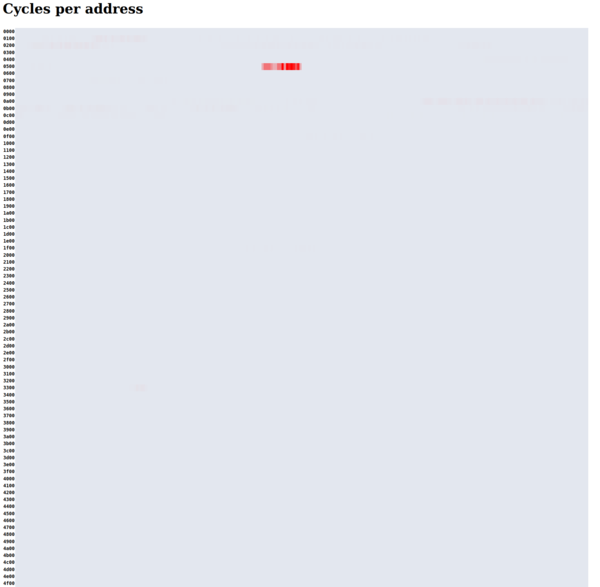
2. Subtle microcode bug
After fixing the quadratic strlen bug, I noticed that the CPU was spending a lot of time executing instruction opcode 0xff. You can see on the instruction set cheatsheet that 0xff is slownop. It's an instruction that spends 8 cycles to do nothing. I was surprised that it was spending so much time executing this instruction because the generated code did not include even a single usage of it.
I eventually traced it back to the microcode for the ld (i16), r instruction. The microcode for T-state 7 was YO MI P+, or in other words, "put register Y on the bus, load the bus into the current selected memory address, and increment the program counter". But the microinstruction that the emulator was running was just YO MI, without P+: it wasn't incrementing the program counter. When the program counter doesn't get incremented to skip over the argument, the argument gets executed next! That's pretty bad, because the argument could be anything. I shudder to think how I could possibly have debugged this on actual hardware. I would probably have assumed that my code was doing weird things due to unknowable signal timing problems and left it broken.
So why was it so often 0xff and not just random values? Because the i16 argument is almost always a pseudoregister, i.e. an address in the top 256 words, i.e. 0xff00 to 0xffff.
Why is the P+ flag missing from the microcode that is being executed? The P+ flag occupies the same bit in the microinstruction as one of the ALU control bits (see the "Decoding" section of the microcode documentation). This means P+ is only available when the ALU is not in use, but the YO microcode has to use the ALU to load Y onto the bus because the Y register has no mechanism to do this directly. So YO P+ is impossible microcode!
Why didn't I notice this sooner? Well I actually did have a check in the microassembler to reject any code that tries to use the ALU and P+ in the same clock cycle. The line was:
die "P+ with ALU not allowed: $uinstr\n" if $have_alu && $uinstr =~ /\bP\+\b/;Can you spot the problem? It took me a while even when I knew it didn't work! The problem is that in "YO MI P+", the word boundary is considered to be between the "P" and the "+", not after the "+". So the regex never matches anything. D'oh!
3. Executing globals
After I fixed the ld (i16), r microcode, I still saw a non-zero number of slownop executions. The reason for this was much more tame: the compiler puts globals after the code it generates. The resulting binary is produced by assembling the concatenation of head.s which just initialises the stack pointer, then the code generated by the compiler, and then foot.s which halts the emulator and contains some assembly language functions.
The problem is that the compiler doesn't do anything to avoid executing the globals! Once the main program has finished, execution carries on straight through the globals and does whatever random nonsense is encoded there. I didn't notice this sooner because it normally has no noticeable effect: as long as execution eventually makes it out the other side, into foot.s, the emulator halts and nobody is any the wiser. It doesn't even matter if the "code" in the globals trashed all of the registers and overwrote loads of memory. As long as the machine promptly halts and nothing appears on the serial console, it appears to be working correctly.
Still to figure out
Slurping the source into memory
The Perl implementation of the compiler slurps the entire source into memory, because that's a fine and reasonable thing to do on a modern computer in 2021. It's unfortunately not a fine thing to do if you only have 64K of address space. The compiler source totals about 34K bytes, which is too much to be loading into memory, and the compiler currently runs out of memory trying to compile itself unless you strip whitespace.
I think I plan to use a 256-byte or so ring buffer to store the input source, and if the parser ever tries to backtrack further than 256 bytes (i.e. past the oldest data in the ring buffer), then we'll just bail out and tell the user to make their variable names shorter.
varargs
I don't care about varargs in general, but I really like printf(), so I am keen to be able to use varargs functions in SLANG, even if I have to implement them in assembly language. The problem is that the method of pushing arguments in the order that they appear in the source means that the first argument to printf() (the format string) is the first argument pushed on to the stack, which means it's the last argument popped off. Normally printf() can "safely" work out how many arguments it needs to pop by examining the format string, but that doesn't work if it needs to know how many arguments to pop in order to work out where the format string is. Potential solutions include:
- pass the format string as the last argument: printf(1, "jes", "%d. Hello %s\n");
- manually pass a final argument saying how many arguments there were: printf("%d. Hello %s\n", 1, "jes", 3);
- have some way to tag functions as "varargs", and push an additional parameter saying how many arguments there were
- pass an additional argument saying how many arguments there were to all functions, and just accept the runtime performance hit on every function call
- buffer the generated code for each function argument and emit them in reverse order, and just accept the compile-time memory usage hit on every function call
I don't massively like any of these solutions. Number 1 is horrible at first glance, but potentially tolerable, and has the benefit of being very easy to implement. It's likely that I'll accidentally use it wrong sometimes, but it's the kind of bug that is easy to notice and fix. Number 2 is asking for trouble, because I can both forget to pass this argument, and pass the wrong number when I don't forget. Number 3 would mean variables need some sort of "type" to say whether they point at a varargs function or something else, which I am opposed to on ideological grounds. Number 4 might not actually be too crazy, because it also allows for a pleasant fix to the current footgun where passing the wrong number of arguments to a function breaks everything in confusing ways. Number 5 is probably not ideal because compile-time memory usage is at a premium at the moment, but that problem will go away when I stop slurping the entire source file into memory, so I think it could definitely work.
I think numbers 1, 4, and 5 are the likely solutions. I can do number 1 right now with no compiler changes required (if printf() is implemented in assembly language, so that it can manipulate the stack itself), but maybe the runtime impact of 4 wouldn't be too bad, I should profile it and find out. And 5 probably wouldn't be too hard to do.
If you can think of a better solution than those I listed, or if you have any further arguments for/against any of the options, I'd be interested to hear from you.
Magnitude comparisons
The code generated for magnitude comparisons is still annoyingly broken. This means expressions like x < y sometimes evaluate to true even if x is greater than y! It compiles into something like "subtract y from x and see if the result is negative". The problem is that integer overflow means the sign bit can be the opposite of what you want. If I had a carry bit this would be easy to solve, but I threw that away a few weeks ago on the basis that I couldn't think of a use for it. Hah.
I will probably work on this when I get to writing a program where I care about it, but I expect it might end up a bit hairy.
I also probably want to provide some way to ask for signed vs unsigned magnitude comparison.
Progress on PCBs
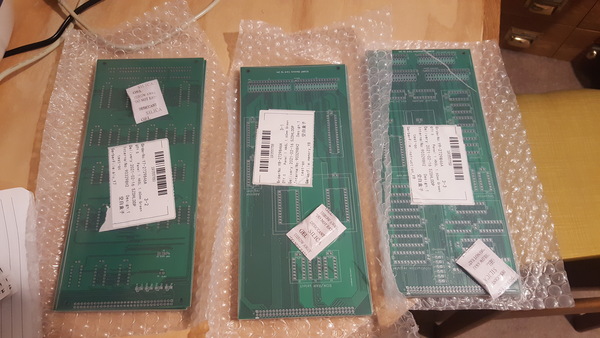
My ALU, Memory, and Instruction card PCBs arrived from China today, sooner than expected.
It would appear that planning to mill the backplane PCB myself was a bad decision, because so far that project has both taken longer and cost more money than just adding the backplane to the JLCPCB order would have done. Oh, well. Perhaps foolishly, I still believe that starting from right now, it will cost less money and time to persist in making it myself than to get the backplane made at JLCPCB.
Abetusk has been a lot of help, in both creating gbr2ngc, and advising me on how to get the most out of it.
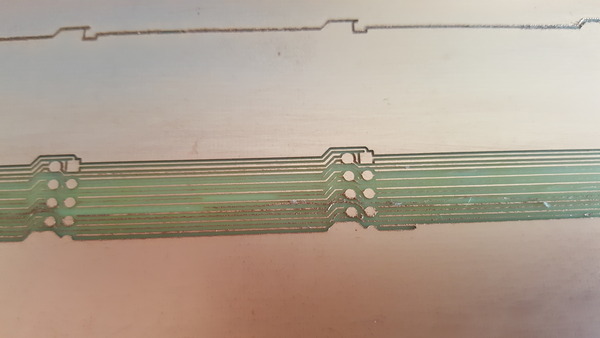
Here's a picture of my backplane test piece, held up to the light:

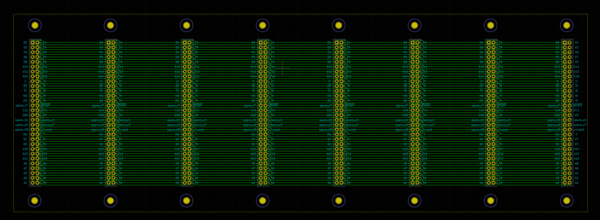
The tracks are well defined, although extremely thin: about 0.3 mm across. The full PCB layout is this:
I thought the test piece looked like it was going to work, so I then moved on to trying to make the actual backplane, but then I broke my only good engraving tool, and the "bad" engraving tools cut a line that is too wide, because the tip is not concentric with the shaft:
I am going to try again with a couple of different types of tools, but might give up and get it from JLCPCB instead.
Abetusk recommended using 25° tools instead of 10° because they are more robust, but the wider angle comes with more sensitivity to height variation. I have also acquired a 0.2 mm end mill, although I don't have high hopes for its robustness.