
Some dubious mathematics and lots of guesswork. Maybe the conclusion is within a few orders of magnitude of correct...
What was the total computing power of the entire world in 1970?
I found a paper by Martin Hilbert and Priscila Lopez that helps to answer this question. It was published in "Science" magazine (?). "Science" is gatekeeping access to the content, so you can't actually read it very easily. Fortunately, SciHub to the rescue: The World's Technological Capacity to Store, Communicate, and Compute Information (if the link doesn't work, just try one of the many SciHub mirrors you can find all over the web). Hilariously, "Science" magazine themselves have quite a good article on how great SciHub is.
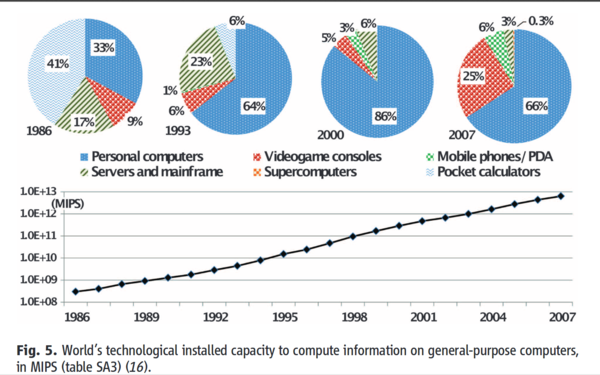
The part of the paper we are most interested in is figure 5, "World's technological installed capacity to compute information on general-purpose computers, in MIPS":
Assumption: MIPS is a useful way to measure computing power.
(Some interesting asides: they estimate that, in 2007, a good 25% of the entire world's computing power was in the form of videogame consoles. Even more astonishing, in 1986, 41% was pocket calculators! Supercomputers have never been more than about 0.5%. Abundance of a particular type of device is clearly a much more important multiplier than raw power. Of course, it's also likely that the world's most superdupercomputers are kept secret...)
The chart gives us data from 1986 to 2007, but there seems to be a clear trend, so let's extrapolate it back in time a bit (note the scale is logarithmic).
Assumption: Extrapolating this data backwards in time is valid.
The raw data is in "table SA3", which is not included in the paper, but is in the "supporting online material" which is thankfully available direct from "Science". All 254 pages of it.
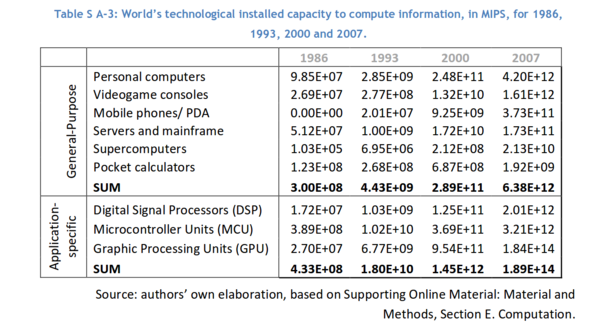
Eh? Only four data points? What about all the other points shown on the chart in figure 5? Never mind. Onwards.
I used PlanetCalc's function approximation tool to calculate an "exponential regression" to fit the 4 data points, where y is the total computing power in MIPS, and x is the year.
y = e0.4868x - 947.4013
It has a "correlation coefficient" of 0.994, which sounds good.
Let's try a quick sanity check. The first computer capable of at least 1 MIPS was the IBM 7030, first produced in 1961. Our exponential function places world computing power in 1961 at 834 MIPS. According to the History Learning Site, there were 250 computers in total in 1955, and 20,000 in 1965. This might put the number in 1961 at around 3,500 computers (again by exponential regression). If they averaged 0.23 MIPS (834 MIPS divided by 3,500 computers), then we're pretty close. That sounds believable. At a minimum, 834 MIPS is neither an unrealistic over- nor under-estimate.
Assumption: The exponential extrapolation I've done is accurate enough to be useful.
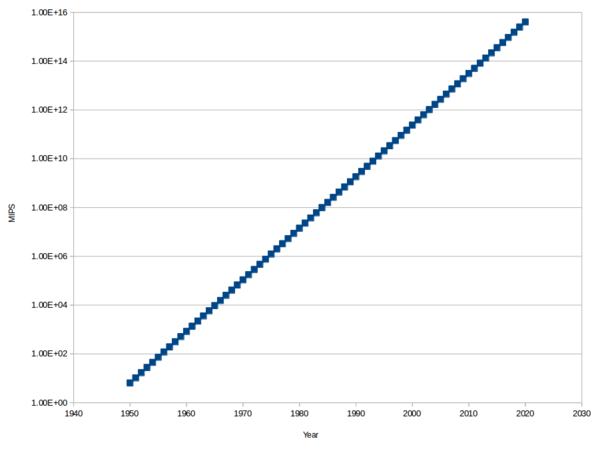
The exponential regression estimate of world computing power gives us this chart:
(The raw data is in the table at the end of this post, or calculate it yourself using the formula above).
How much does computing power cost today?
For a representative figure, let's look at renting a CPU on DigitalOcean. The most cost-effective way to rent CPU time on DigitalOcean is with a $5/mo instance. You get 1 CPU at a total cost of $5/mo + VAT = ~£4.35/mo. According to /proc/cpuinfo the CPU is an "Intel(R) Xeon(R) CPU E5-2630L v2 @ 2.40GHz". (I checked a handful of DigitalOcean machines I have, and they all listed the same CPU).
/proc/cpuinfo tells us that this CPU offers 4800 "BogoMIPS". Unfortunately BogoMIPS (as the name suggests) are not comparable with actual MIPS.
I found an article by Techspot which suggests an "Intel Xeon E5-2630 v4" provided around 37,000 MIPS in their 7zip benchmark. I don't know how close a v2 CPU is to a v4, and I don't know if Techspot's MIPS are comparable to the ones used by Hilbert and Lopez, but we'll just have to assume that they are close enough.
Assumption: A DigitalOcean CPU gives us about 37,000 MIPS. This will be wrong in the following ways: the 7zip benchmark is not the same type of MIPS; each droplet has access to a shared CPU, not the entire thing.
How much would historical computing power cost today?
Assumption: You can actually rent tens to hundreds of thousands of CPUs on DigitalOcean without them putting their prices up.
At £4.35/mo for 37,000 MIPS we get a cost of 12p per month per 1000 MIPS. We already have an estimate of how many MIPS were available in the entire world for any given year, so let's multiply that by 12p per month per 1000 MIPS to get an estimate of how much it would cost today to rent those MIPS.
(The raw data is again available in the table at the end of this post, or calculate it yourself).
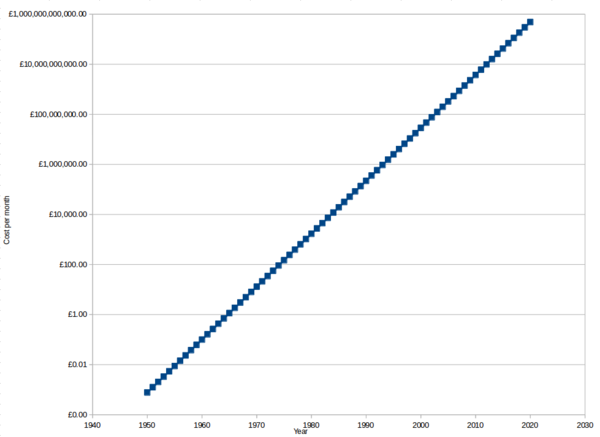
Again note that the y axis is a log scale. This makes it easier to differentiate the smaller values, but the true nature of the data is much more striking with a linear scale:
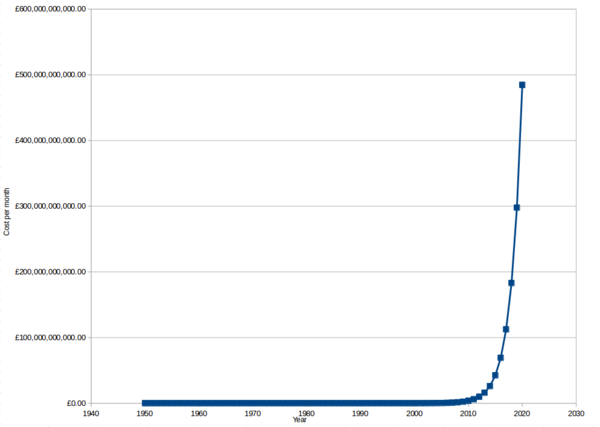
It's practically free to rent an equivalent to all of the computing power that existed in the entire world at any time before 1960, and in fact you can't even rent a single CPU slow enough to be equivalent to the world's computing power for any time before 1968. That's really quite remarkable. By way of comparison, if you wanted to rent an equivalent of all of the internal combustion engine power that existed before 1960, it would probably cost the same, within 1 order of magnitude, as what it cost at the time.
Renting historical computing power starts to sting, at £150/mo, if you want to rent all of the power that existed in 1975, and by 1979 you're spending over £1,000/mo.
If you want to rent all of the computing power that will exist in 2020, that will set you back about £500 billion/mo, although it should of course be noted that that much computing power won't physically exist in the world until 2020 arrives, and even then it likely won't all be in the form of DigitalOcean droplets.
In answer to the title: it might cost around £13/mo today to rent an equivalent of all of the computing power that existed in the entire world in 1970. So there we have it.
Table
Estimates of the entire world's computing power, extrapolated and interpolated, with cost calculated at 12p per month per 1000 MIPS.
| Year | Computing power (MIPS) | Cost to rent in 2018 (£/mo) |
|---|---|---|
| 1950 | 6.42E+00 | £0.00 |
| 1951 | 1.04E+01 | £0.00 |
| 1952 | 1.70E+01 | £0.00 |
| 1953 | 2.76E+01 | £0.00 |
| 1954 | 4.50E+01 | £0.01 |
| 1955 | 7.32E+01 | £0.01 |
| 1956 | 1.19E+02 | £0.01 |
| 1957 | 1.94E+02 | £0.02 |
| 1958 | 3.15E+02 | £0.04 |
| 1959 | 5.13E+02 | £0.06 |
| 1960 | 8.34E+02 | £0.10 |
| 1961 | 1.36E+03 | £0.16 |
| 1962 | 2.21E+03 | £0.27 |
| 1963 | 3.59E+03 | £0.43 |
| 1964 | 5.85E+03 | £0.70 |
| 1965 | 9.52E+03 | £1.14 |
| 1966 | 1.55E+04 | £1.86 |
| 1967 | 2.52E+04 | £3.02 |
| 1968 | 4.10E+04 | £4.92 |
| 1969 | 6.67E+04 | £8.00 |
| 1970 | 1.09E+05 | £13.00 |
| 1971 | 1.77E+05 | £21.20 |
| 1972 | 2.87E+05 | £34.50 |
| 1973 | 4.67E+05 | £56.10 |
| 1974 | 7.61E+05 | £91.30 |
| 1975 | 1.24E+06 | £149 |
| 1976 | 2.01E+06 | £242 |
| 1977 | 3.28E+06 | £393 |
| 1978 | 5.33E+06 | £640 |
| 1979 | 8.67E+06 | £1,040 |
| 1980 | 1.41E+07 | £1,690 |
| 1981 | 2.30E+07 | £2,760 |
| 1982 | 3.74E+07 | £4,480 |
| 1983 | 6.08E+07 | £7,300 |
| 1984 | 9.89E+07 | £11,900 |
| 1985 | 1.61E+08 | £19,300 |
| 1986 | 2.62E+08 | £31,400 |
| 1987 | 4.26E+08 | £51,100 |
| 1988 | 6.93E+08 | £83,200 |
| 1989 | 1.13E+09 | £135,000 |
| 1990 | 1.84E+09 | £220,000 |
| 1991 | 2.99E+09 | £358,000 |
| 1992 | 4.86E+09 | £583,000 |
| 1993 | 7.91E+09 | £949,000 |
| 1994 | 1.29E+10 | £1,540,000 |
| 1995 | 2.09E+10 | £2,510,000 |
| 1996 | 3.41E+10 | £4,090,000 |
| 1997 | 5.54E+10 | £6,650,000 |
| 1998 | 9.02E+10 | £10,800,000 |
| 1999 | 1.47E+11 | £17,600,000 |
| 2000 | 2.39E+11 | £28,700,000 |
| 2001 | 3.88E+11 | £46,600,000 |
| 2002 | 6.32E+11 | £75,900,000 |
| 2003 | 1.03E+12 | £123,000,000 |
| 2004 | 1.67E+12 | £201,000,000 |
| 2005 | 2.72E+12 | £327,000,000 |
| 2006 | 4.43E+12 | £532,000,000 |
| 2007 | 7.21E+12 | £865,000,000 |
| 2008 | 1.17E+13 | £1,410,000,000 |
| 2009 | 1.91E+13 | £2,290,000,000 |
| 2010 | 3.11E+13 | £3,730,000,000 |
| 2011 | 5.05E+13 | £6,060,000,000 |
| 2012 | 8.22E+13 | £9,870,000,000 |
| 2013 | 1.34E+14 | £16,100,000,000 |
| 2014 | 2.18E+14 | £26,100,000,000 |
| 2015 | 3.54E+14 | £42,500,000,000 |
| 2016 | 5.76E+14 | £69,100,000,000 |
| 2017 | 9.38E+14 | £113,000,000,000 |
| 2018 | 1.53E+15 | £183,000,000,000 |
| 2019 | 2.48E+15 | £298,000,000,000 |
| 2020 | 4.04E+15 | £485,000,000,000 |